This report gives an overview of the information in the snapshot. It consists of two major sections:
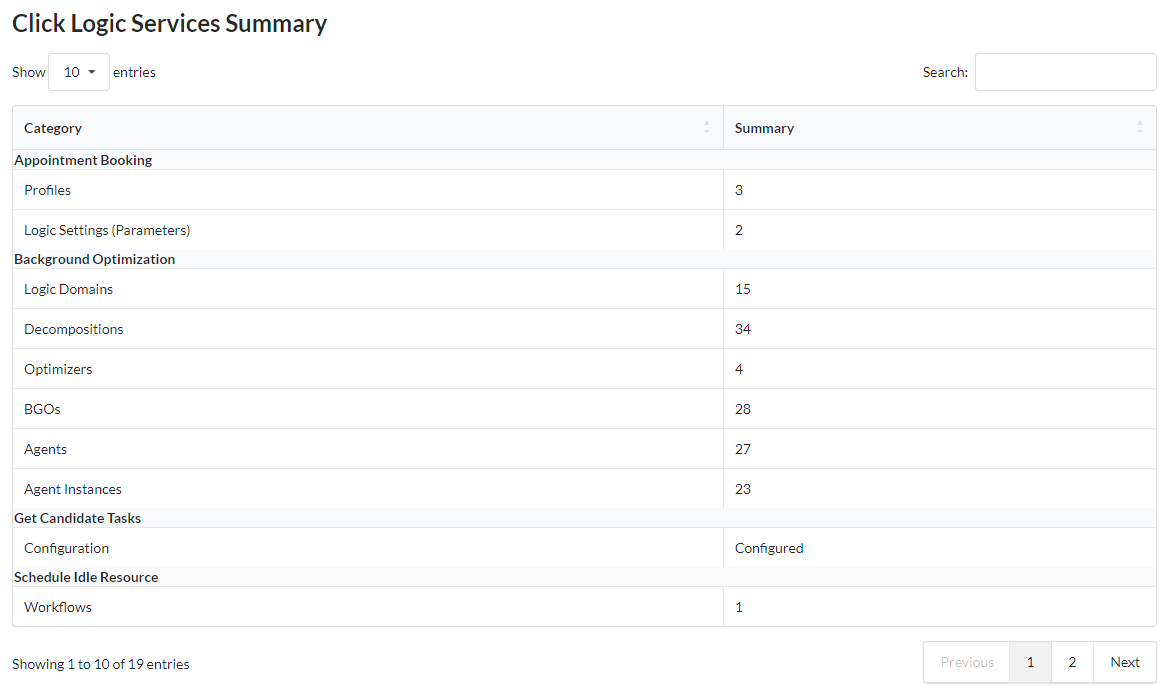
This part of the report gives an overview of Click features configured in the environment. This information on its own is incredibly useful in quite a few situations:
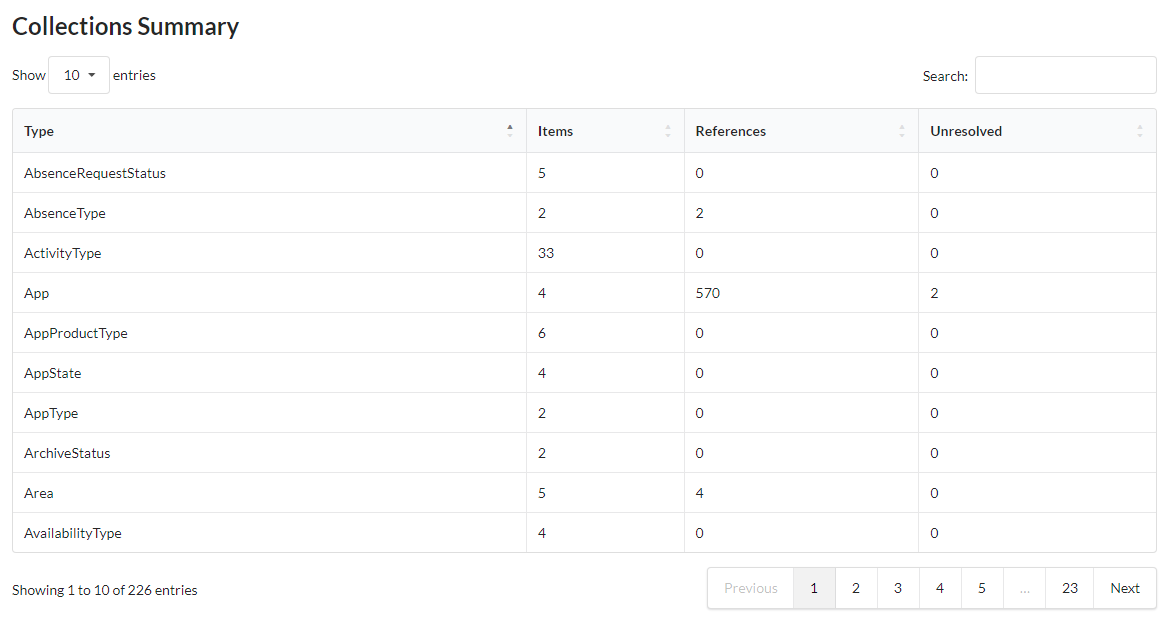
This part of the report gives a product-agnostic overview of the contents of the captured snapshot. It lists the following information by item type:
The reports in this category are entirely product-agnostic, and document structural features of the configuration that have nothing to do with the specific software product, in this case Click. The features in question are:
The report lists all items in the configuration, and for each item lists the following:
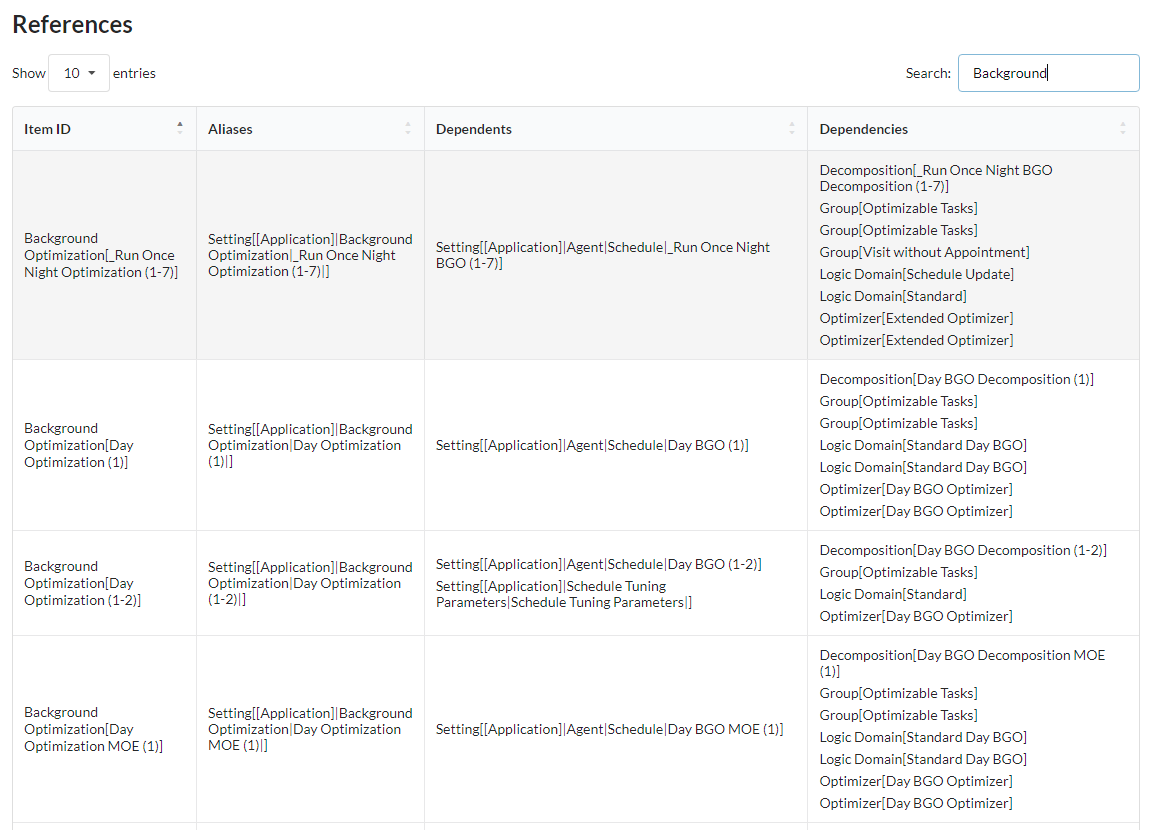
TaskStatus[Key=124147] means that the dependency is on a task status with key 124147 which doesn’t exist in the database.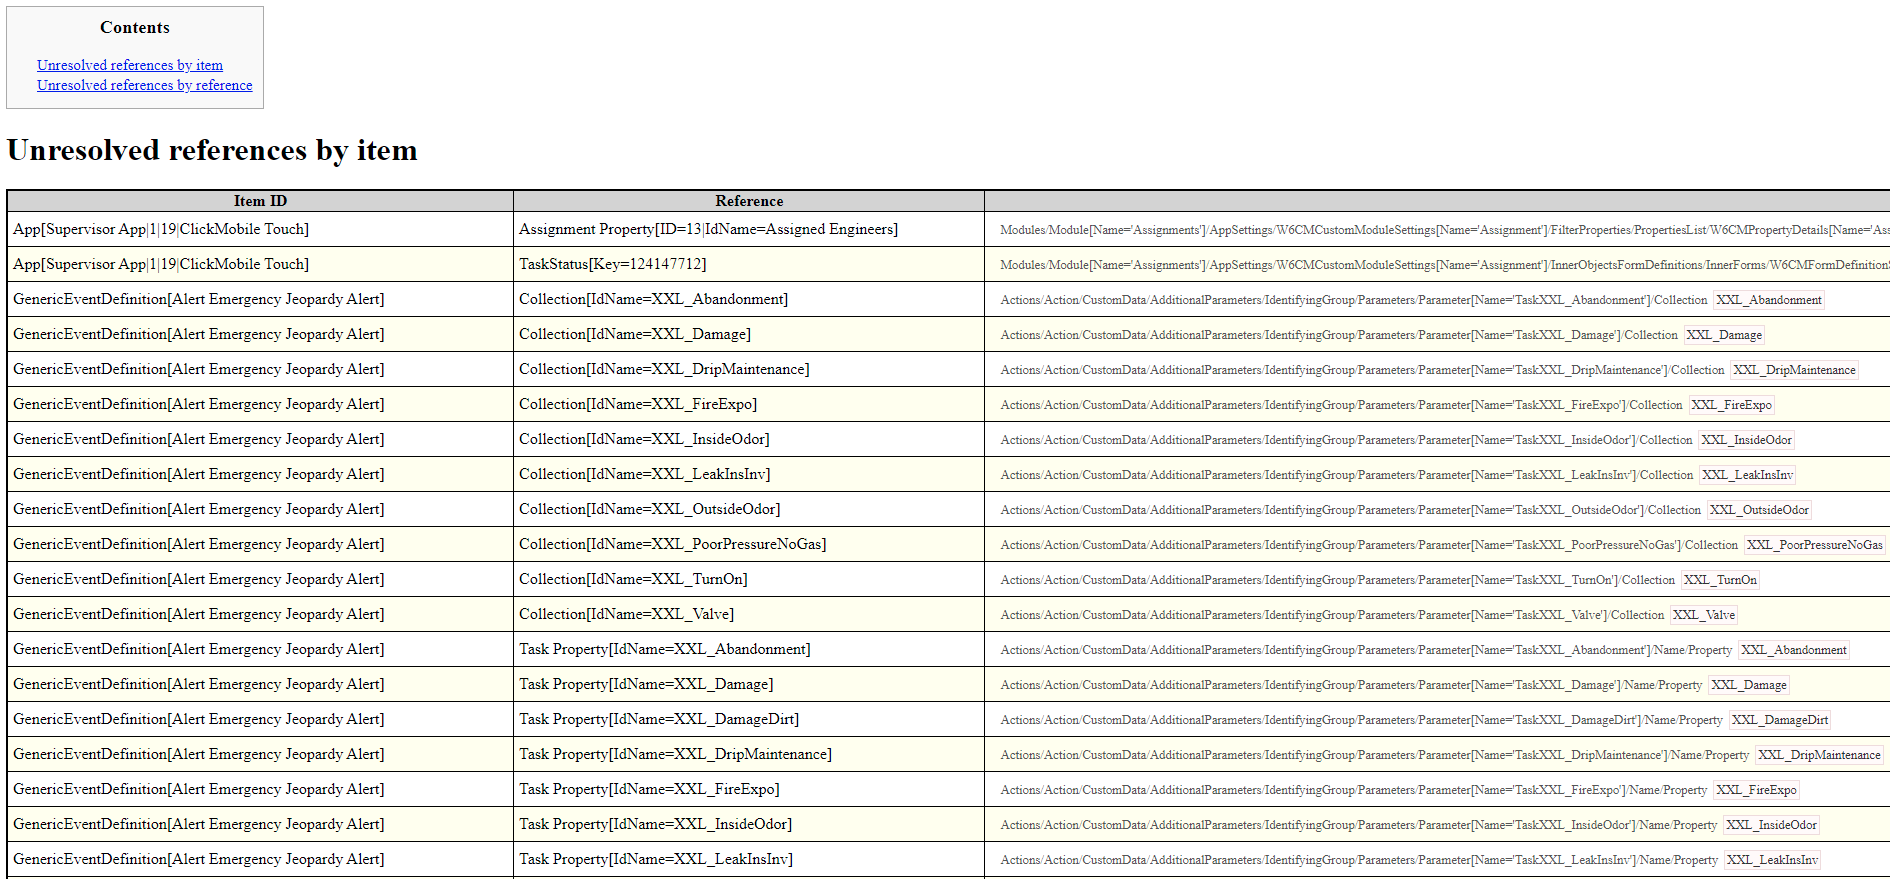
The reports lists all items in the configuration that are not referenced by anything. This indicates that those items are potentially unused.
An item being unreferenced is not necessarily an error. There are a number of situations where an item is expected to be unreferenced, for example:
Still, it is useful to know which items are unreferenced in situations such as configuration clean-up or migration.

This is a somewhat technical report that lists all faults encountered during the processing of the configuration.
While the report will not be very useful in most circumstances, it is indispensable in troubleshooting. We won’t document the information that it contains in detail as it is quite technical and requires some understanding of the way Configo processes configuration information.

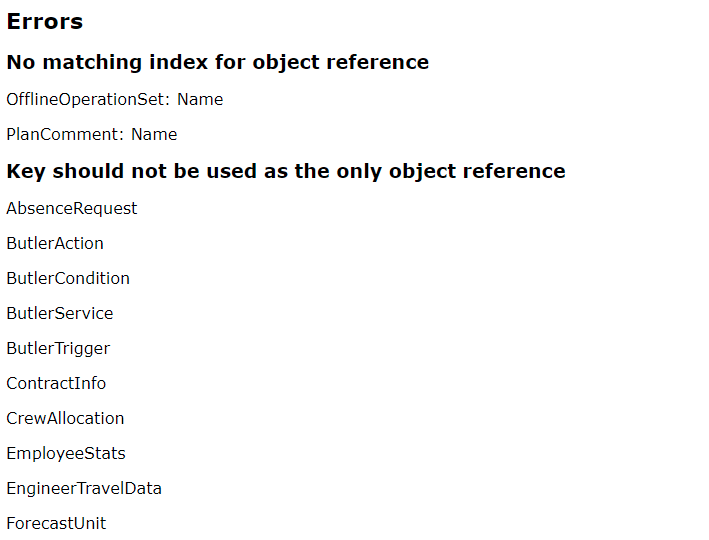
Structure report brings together, in a convenient way, the in-depth and hyperlinked scheme definition, and identity definitions (object references) for the collections for which this information is defined. It also summarises the errors found in the scheme.
The top section of the report summarises the errors found in the scheme, or in the relationship between the scheme and object references.
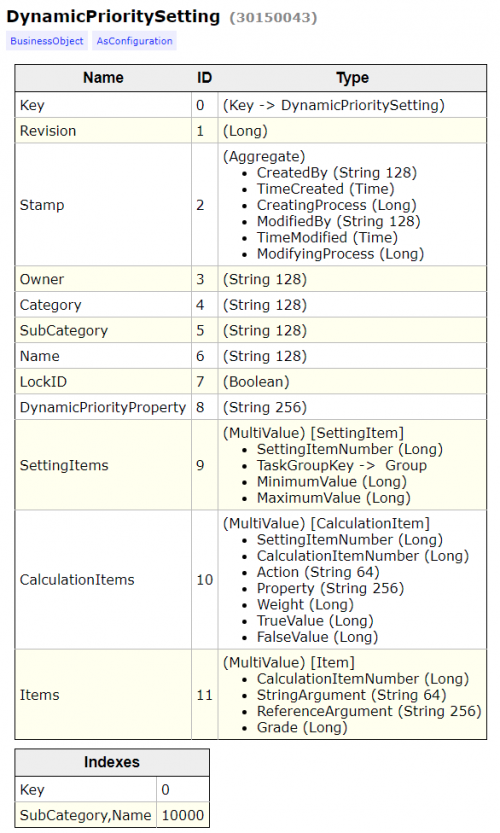
This section of the report contains the definitions of all real or virtual collections, all properties (including their internal structure) and all indexes. It also includes the definition of object references, where present, and highlights any errors related to each particular collection.
These reports document configuration items that are reusable across the whole range of of Click products such as groups, relevance groups and decompositions.
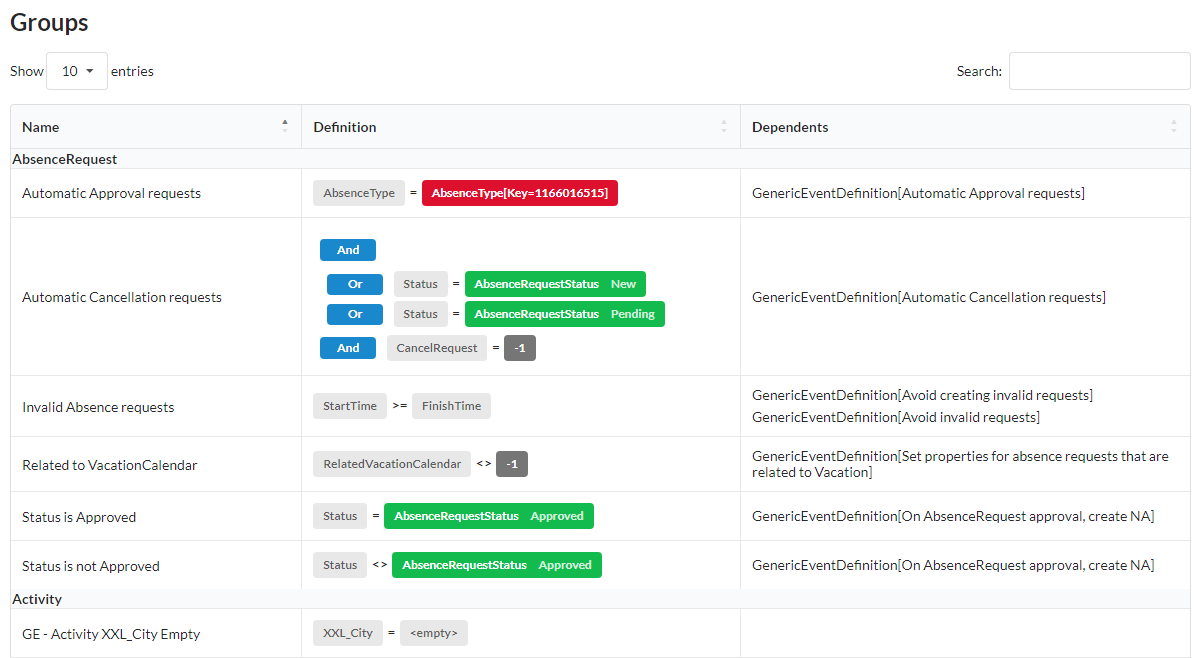
The top section of this report lists all groups (grouped by their type), their definitions (including index and OQL), and how they are used.
The colours in the OQL definition clearly highlight the roles of various elements, including resolved (green) and unresolved (red) references.
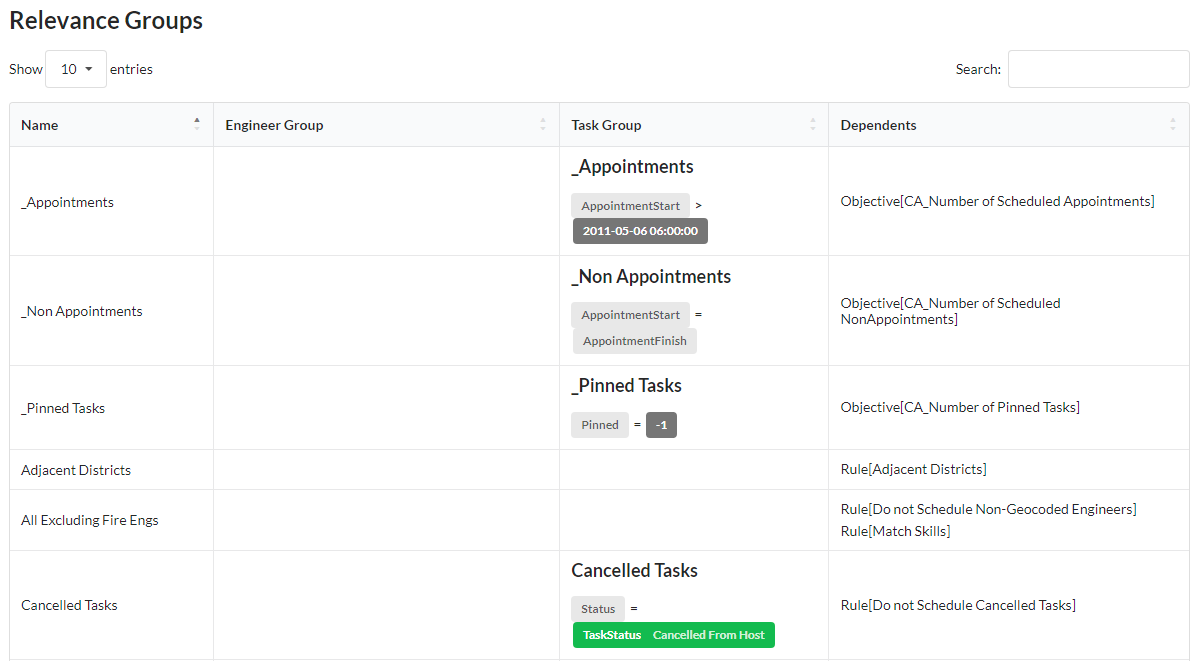
The bottom section of the report lists all relevance groups, their definitions (including repeated definitions of the relevant task and engineer group criteria), and again how they are used.
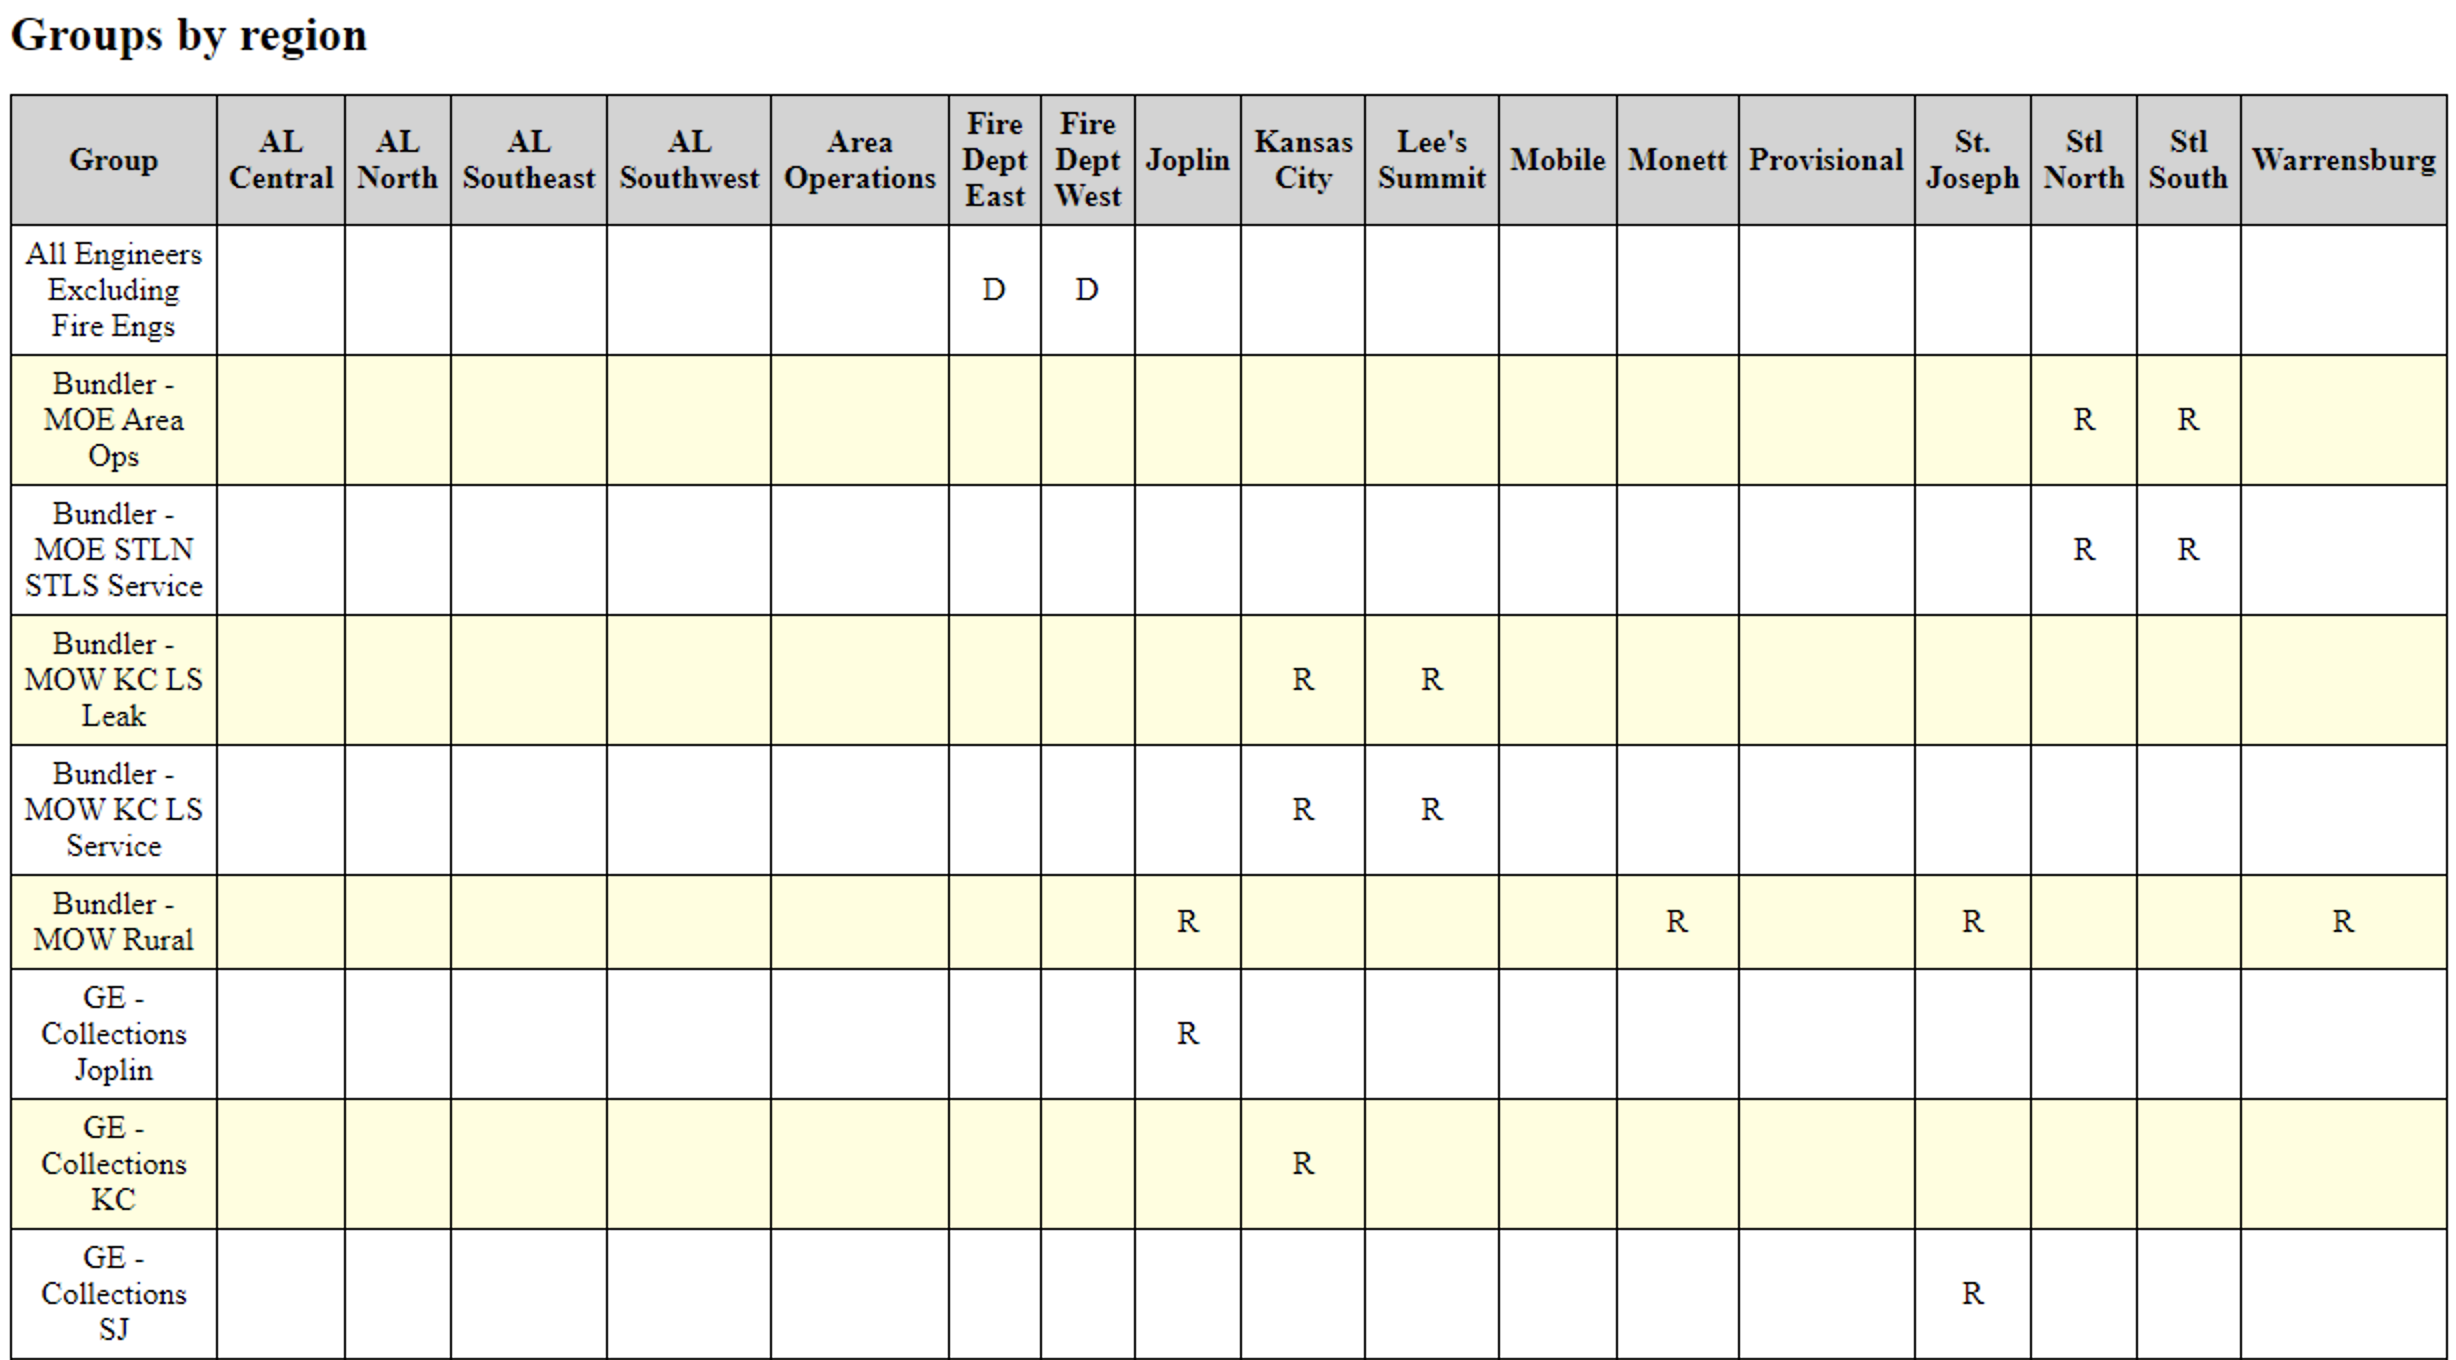
This report displays the matrices of groups versus all regions and districts which are referenced by the group definition.
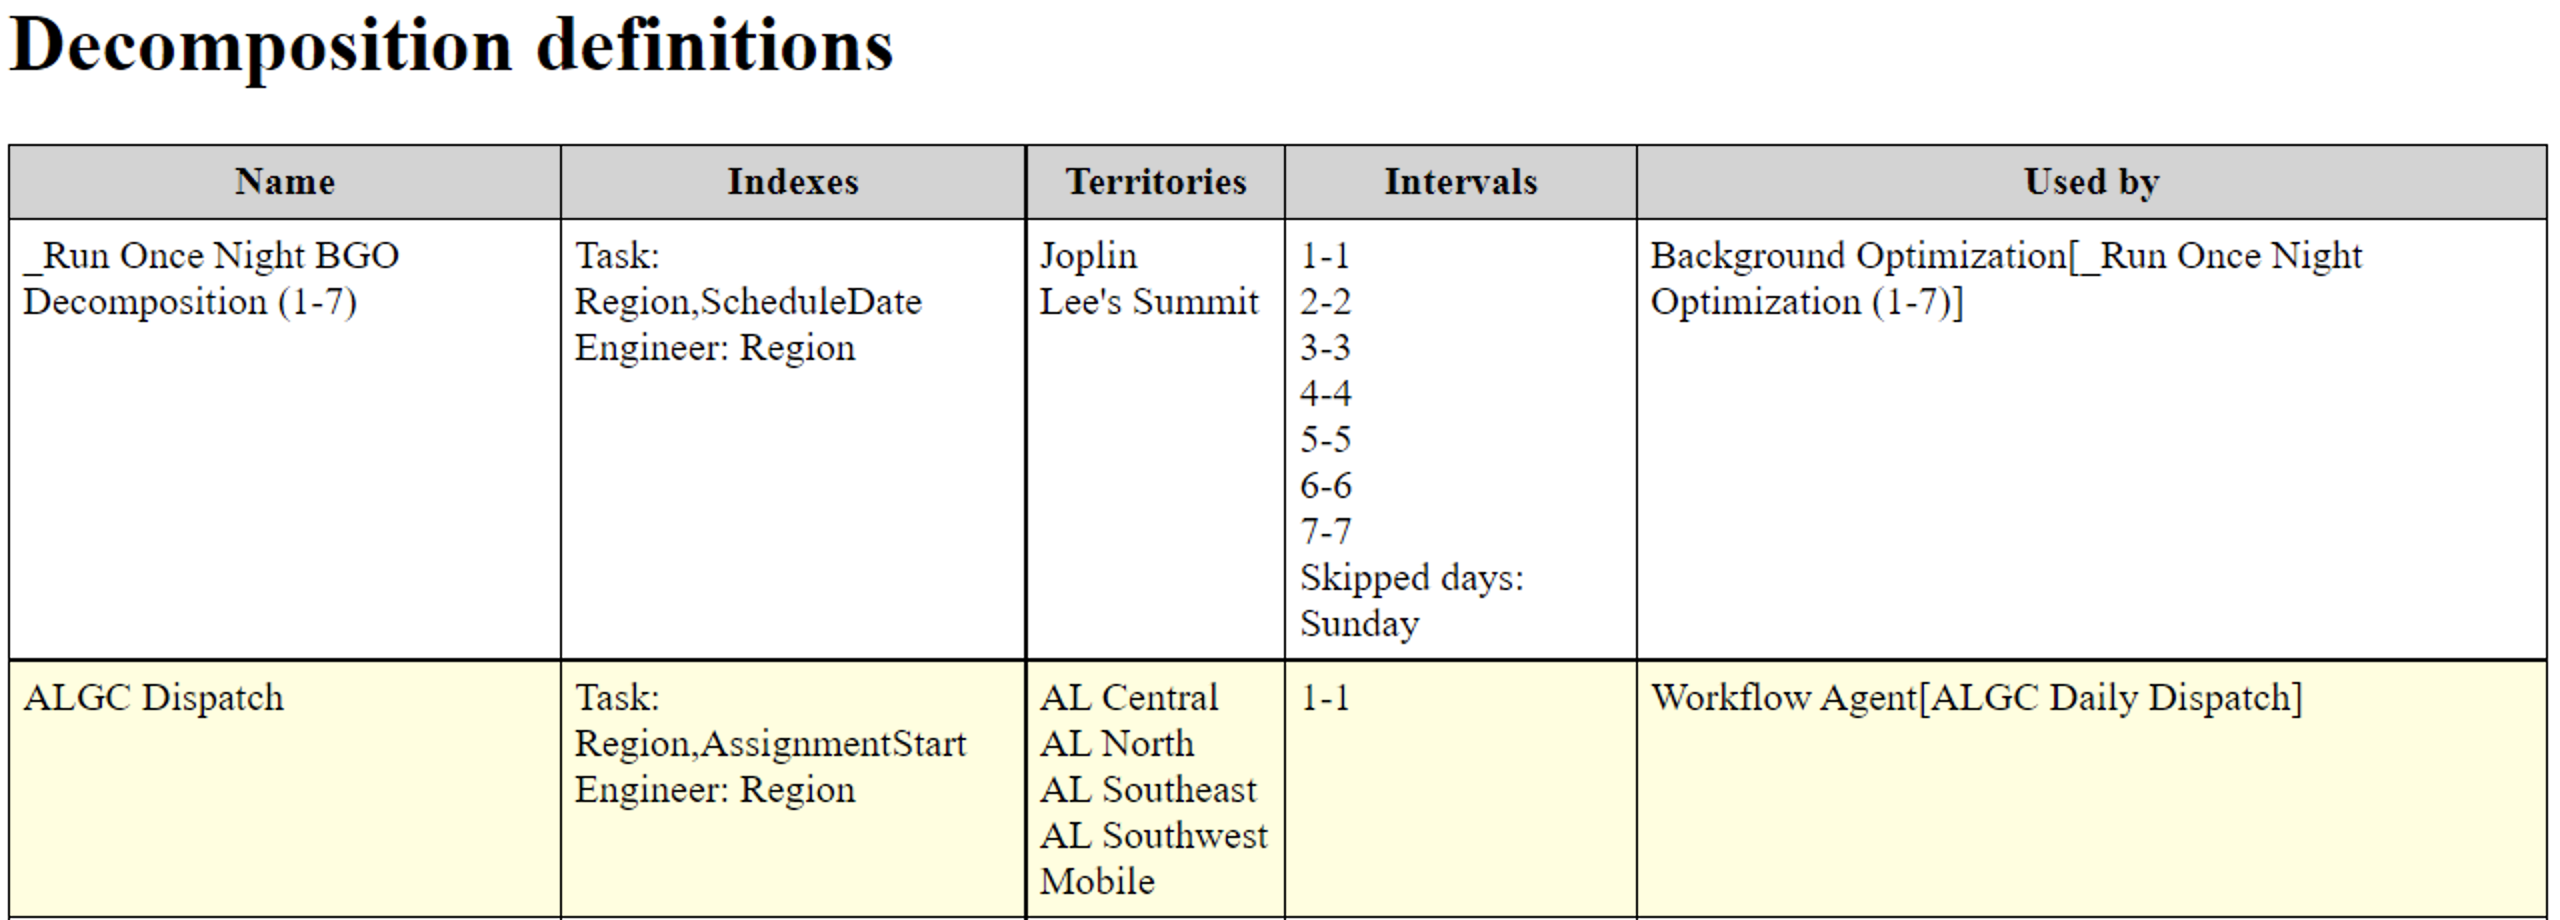
This report gives extensive information about the decompositions defined in the environment from multiple points of view.
First, we have a table containing definitions of all decompositions, including indexes, territories and intervals. The same table also contains all uses for each decomposition.
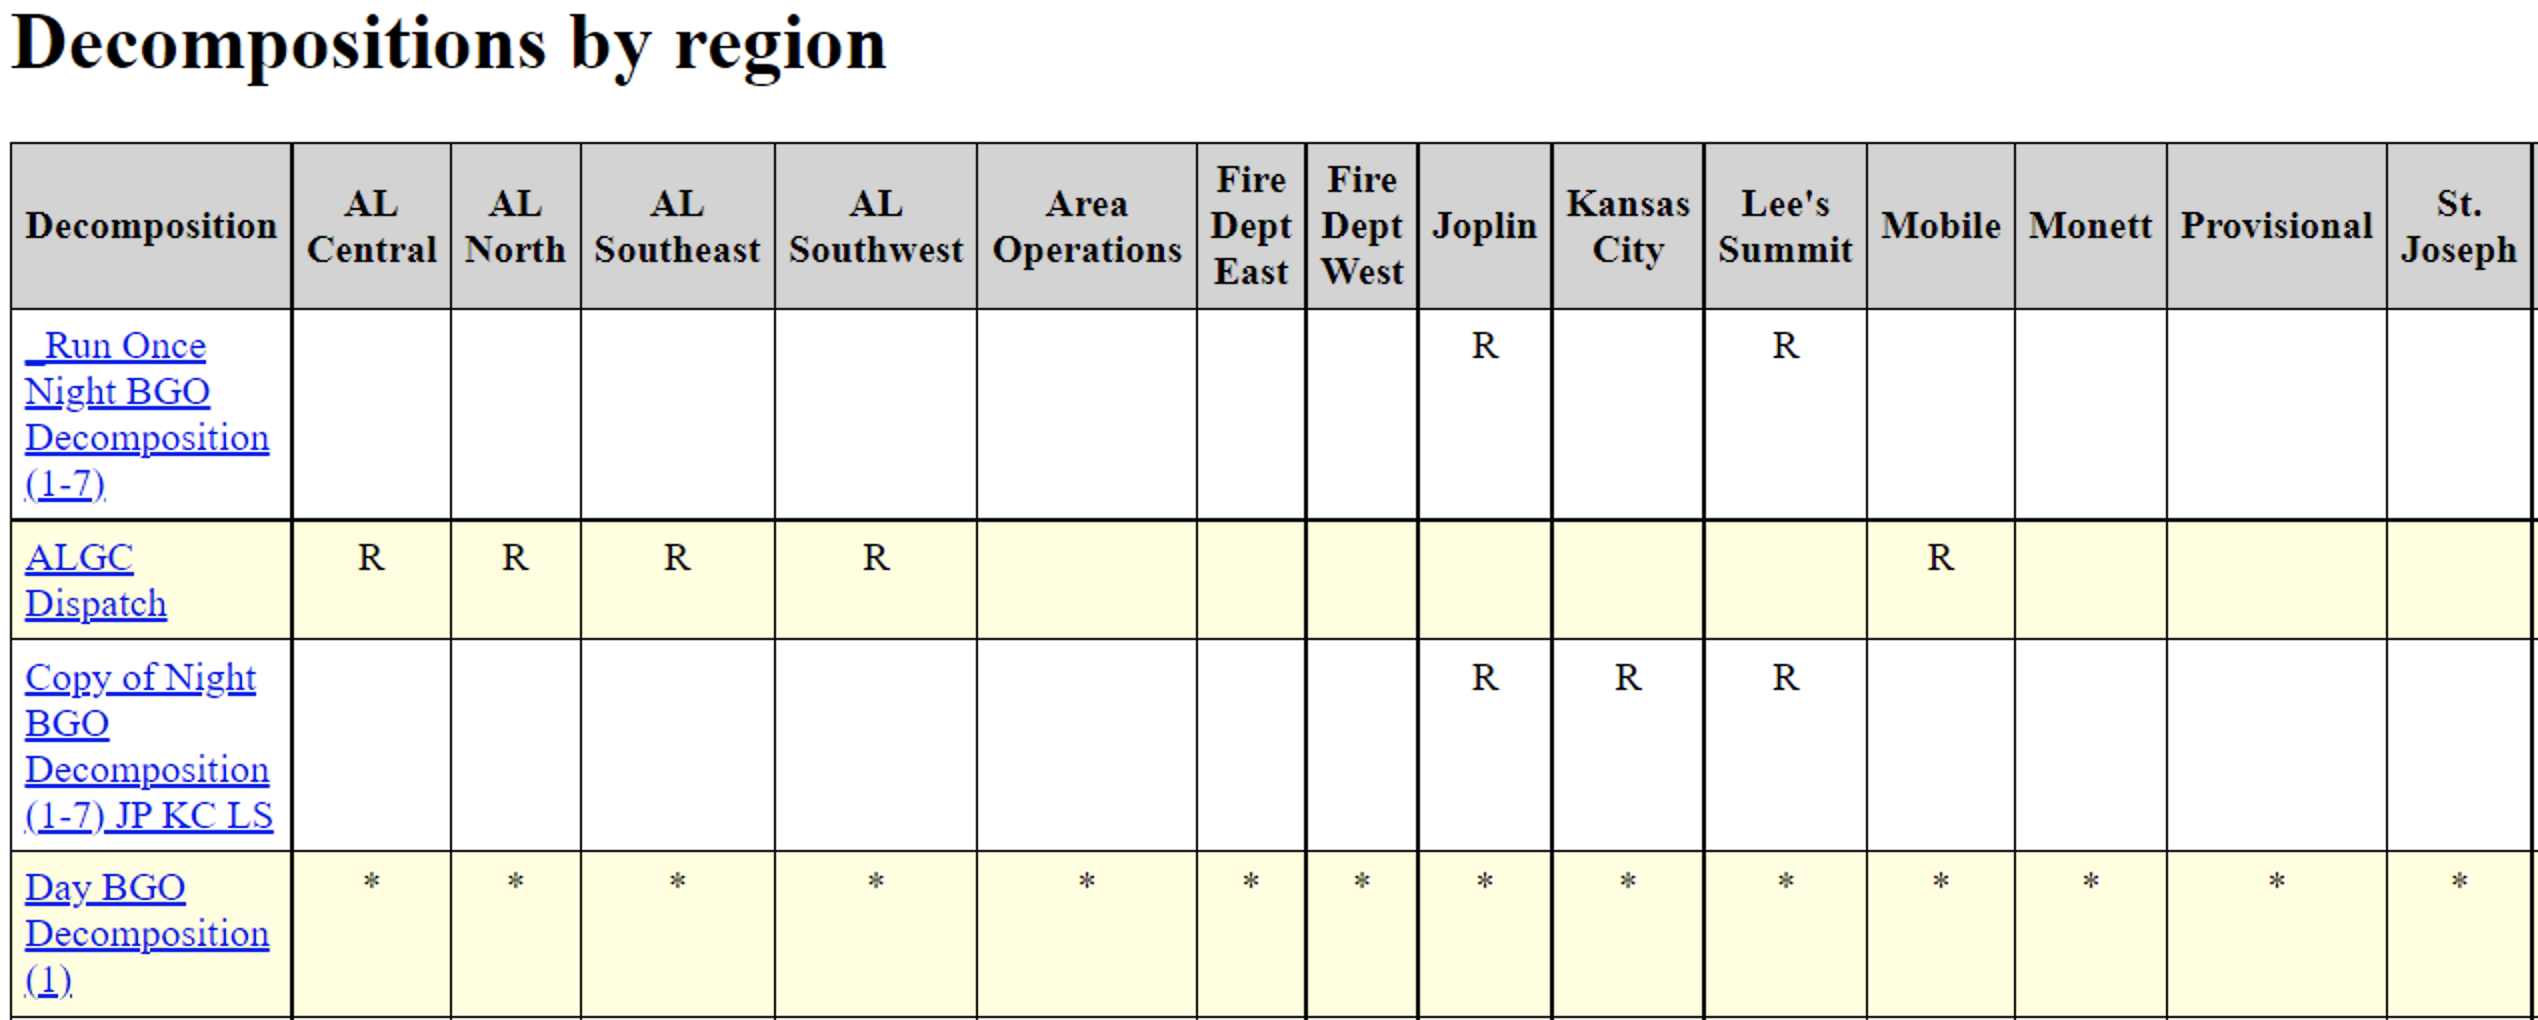
Next, we have matrices showing all decomposition against all regions and districts, and showing where the decomposition includes the region or district in question, either by virtue of including all territories (*), the region (R) or the district (D).
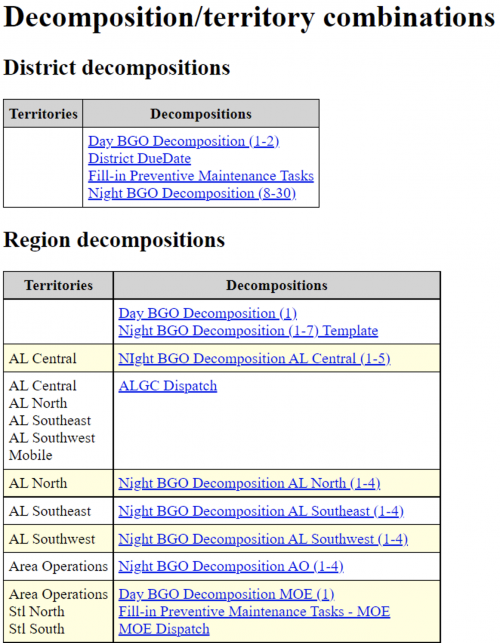
Finally, we list all different territory combinations that feature in different decompositions.
This information is useful for example when making sure that two decompositions cover the same territories, or when trying to understand whether they differ in the territories that they cover by mistake or on purpose. This task that is very hard to accomplish without this report, in particular if the number of territories is large. Misconfigurations of this type are hard to discover and can lead to subtle yet persistent problems for the customer.
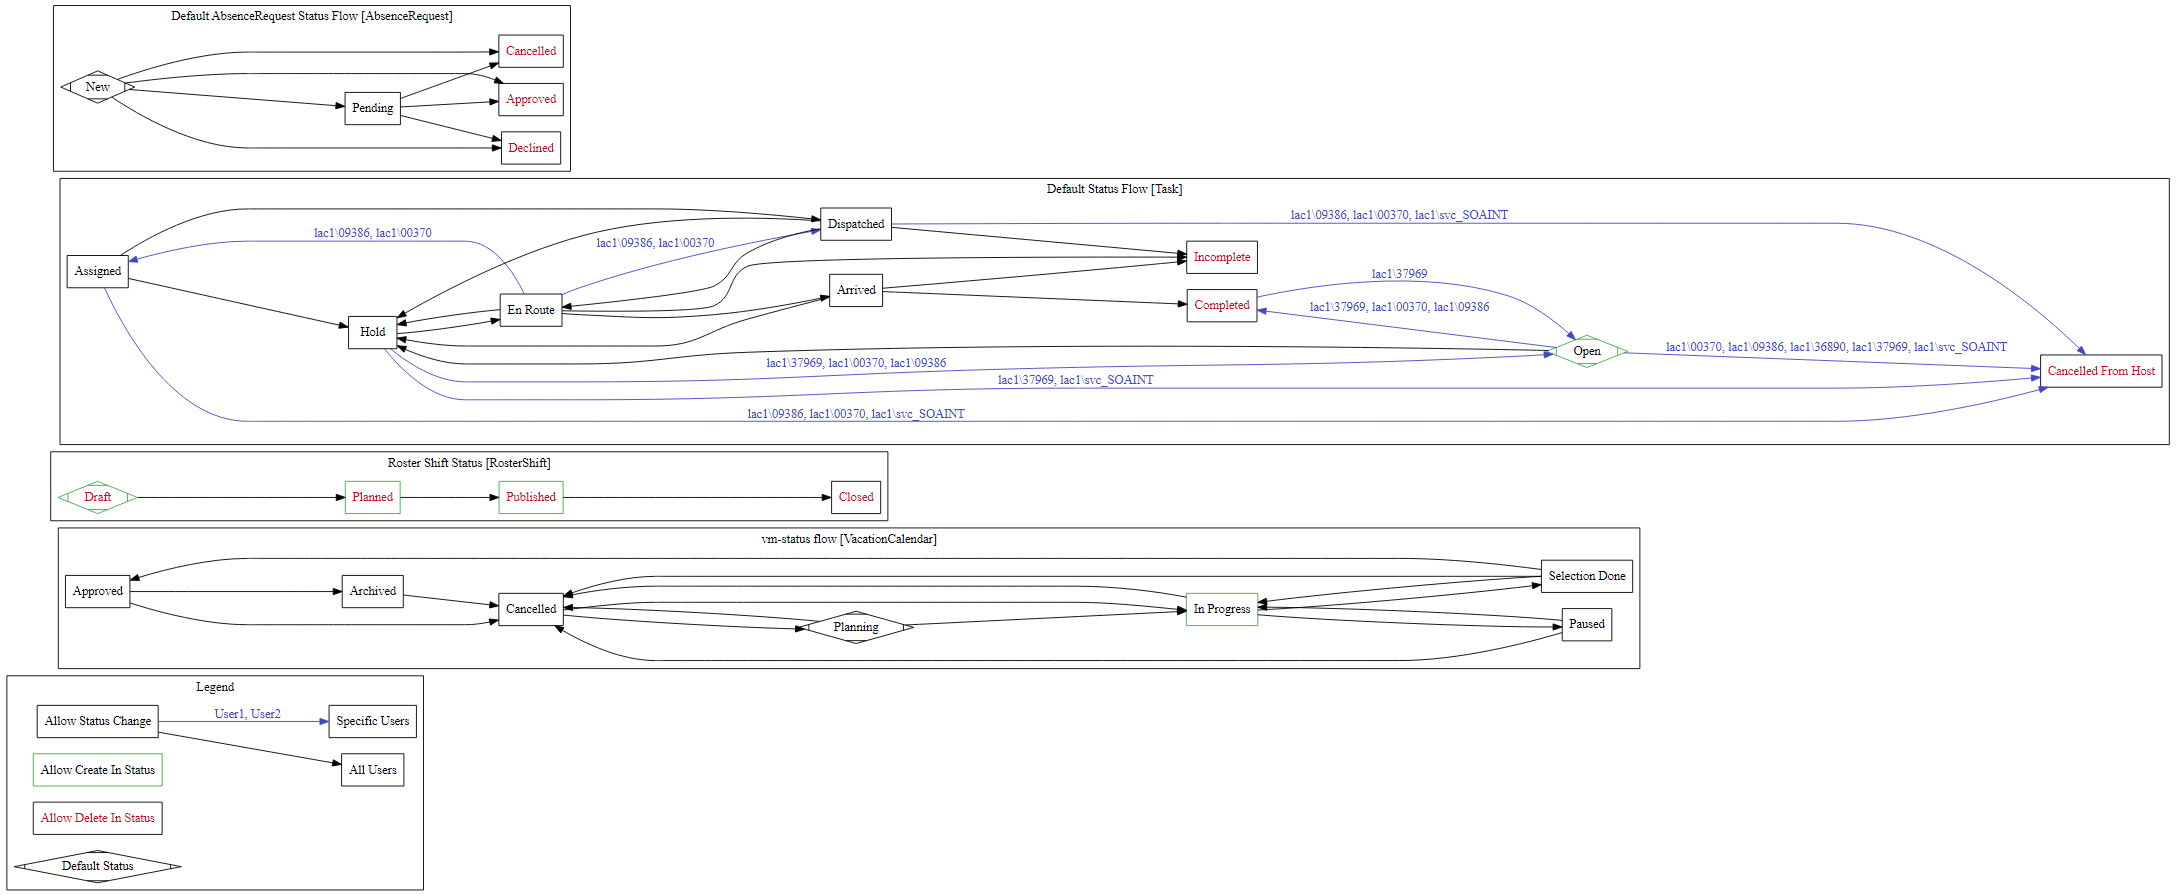
The diagrams in this section visualise status flows (for all objects but tasks) and status transitions (for tasks).
This diagram shows status flows for all objects for which such flows are defined. In addition to displaying statuses and allowed transitions, it also displays which users can initiate each transition (when those are restricted), and in which statuses the objects can be created and deleted.
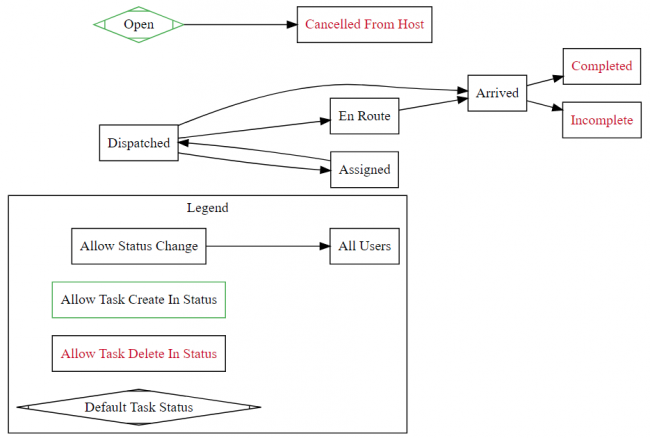
This diagram shows status transitions for tasks. In addition to displaying statuses and allowed transitions, it also displays which users can initiate each transition (when those are restricted), what is the default status, and in which statuses the objects can be created or deleted.
These reports document the configuration of logic services in great detail, allowing users to understand it quickly and decide whether and how changes need to be made, or, in case of migration, which parts of the logic should be considered for reimplementation.
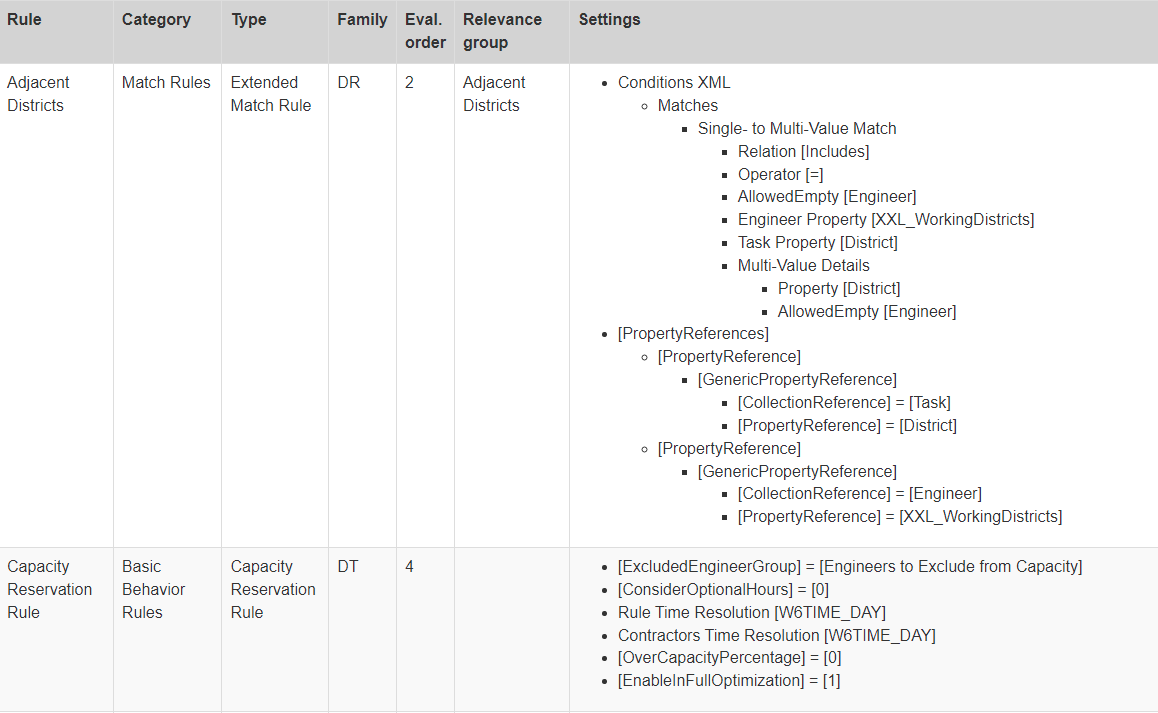
This report contains detailed definitions of all rules configured in the system.
This report contains detailed definitions of all objectives and business value functions configured in the system.
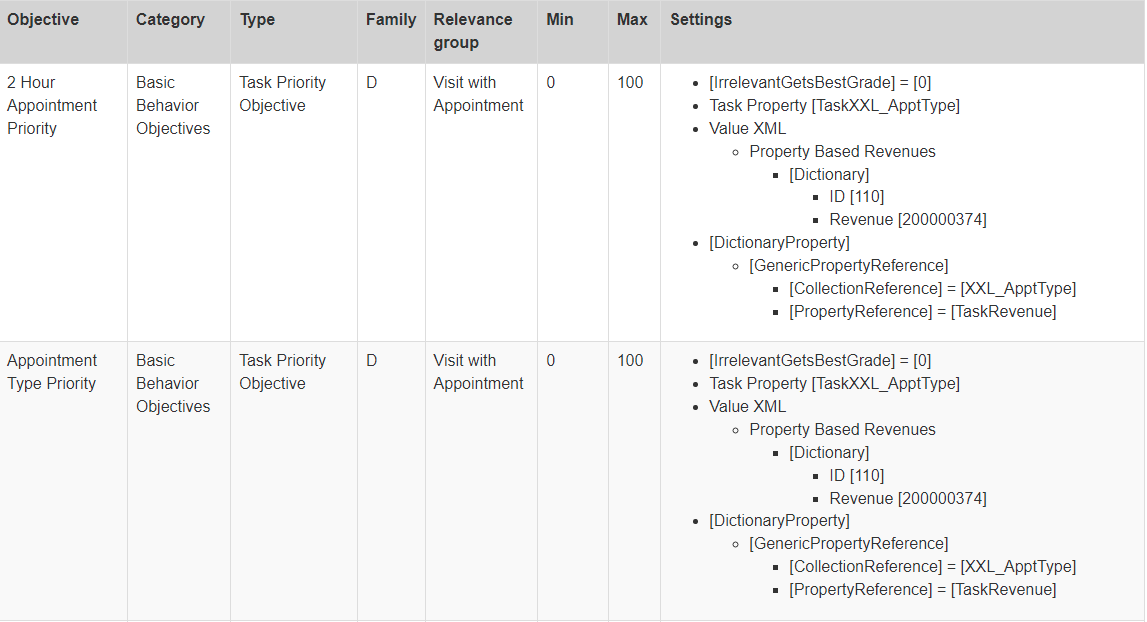
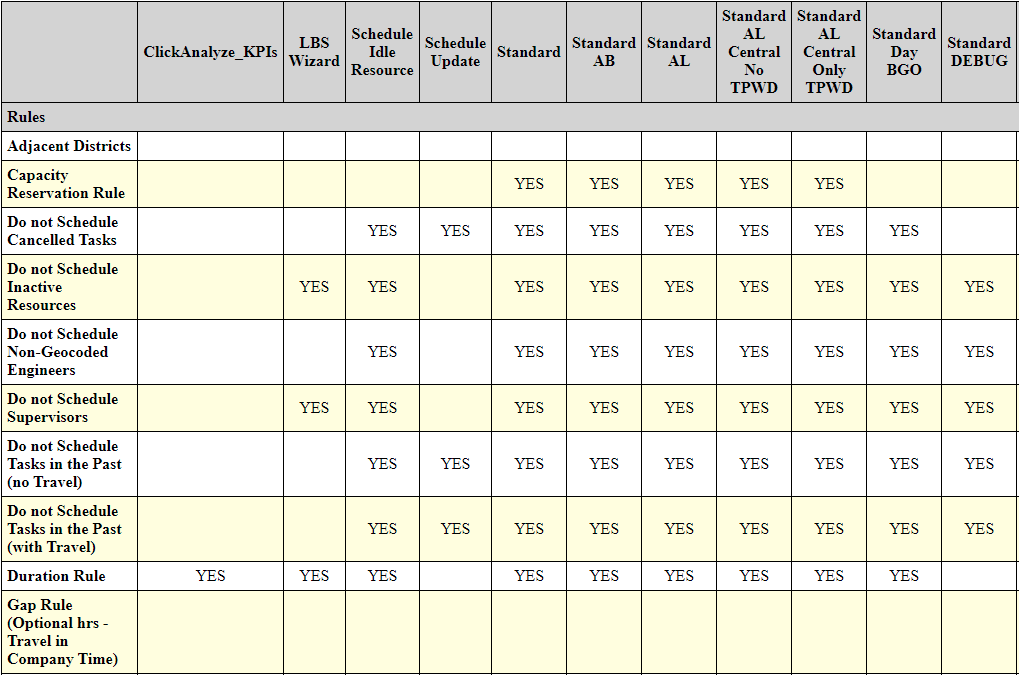
This report displays a table of all logic domains in columns, and all rules, objectives and business value functions in rows, and indicates which rules, objectives and business value functions are used in which logic domains and, in the case of objectives, with what weight.
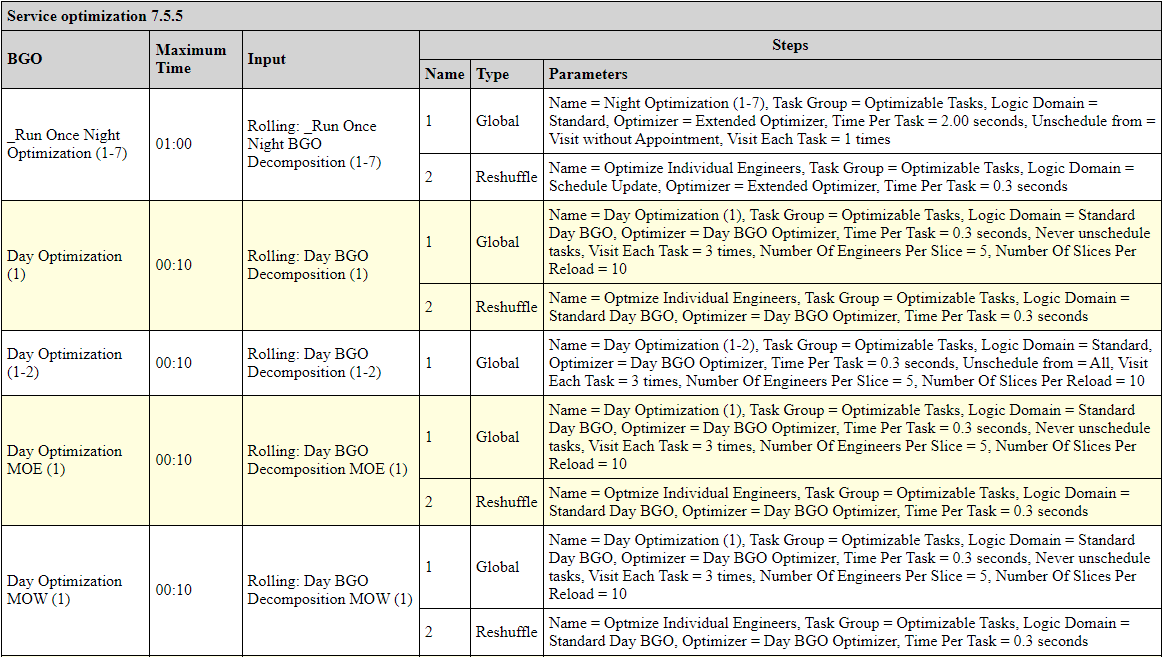
This report displays definitions of all defined background optimizations, including optimization steps and their corresponding definitions.
This report displays definitions of all defined scheduling workflows, including scheduling stages that they use and their corresponding definitions.

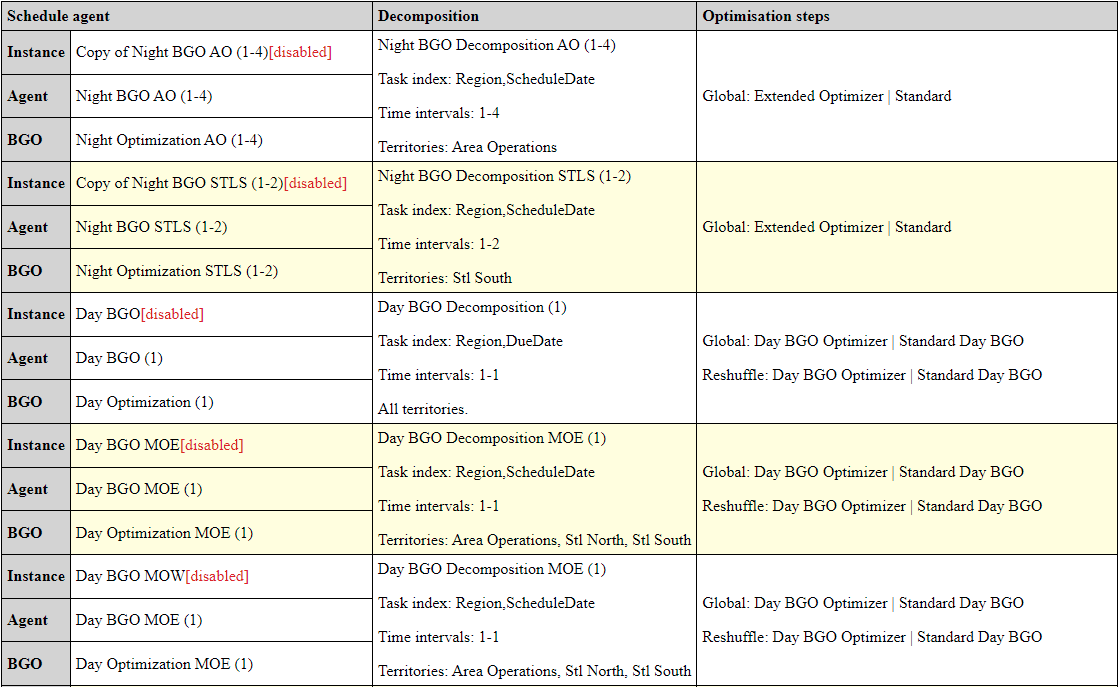
This report displays deep definitions of all schedule agent instances (active ones on top, inactive ones at the bottom), including which agents they use, which background optimization the agent uses, the deep definition of the decomposition including the list of territories covered, and brief overview of optimisation steps.
This report is incredibly useful because it gives a detailed overview of optimisation configuration from multiple levels of settings that would take many hours (and possibly days in complex situations) to prepare manually, not to mention the number of mistakes that would be made in such a manual process.
The reports in this section document Agents Manager configuration in several different ways. This allows users to understand the scheduling of all agent instances in the environment, and the load that they impose on their assigned servers.
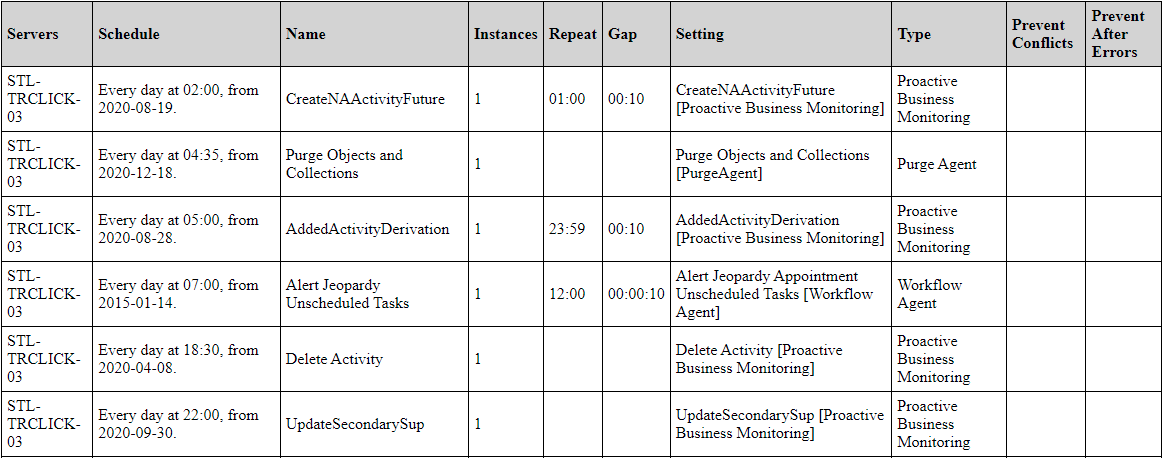
This report lists all agent instances and their Agents Manager configuration. It is only somewhat more informative than the main Agents Manager view in Service Optimization Administration, but is included both for completeness of documentation and for revision control purposes.
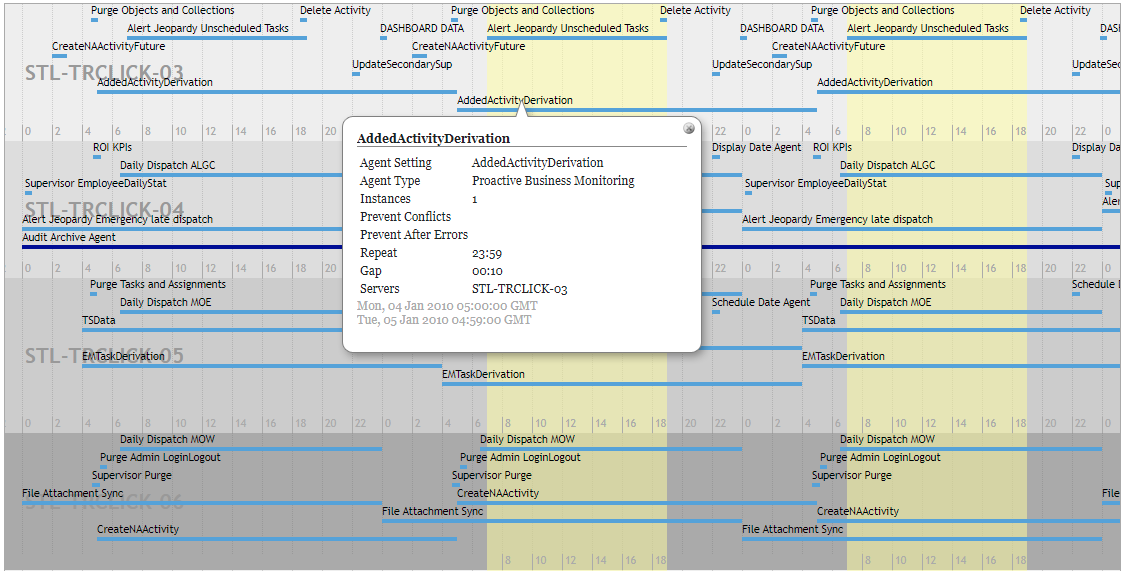
This diagram graphically shows which agent instances are scheduled to which application server at what time on a weekly basis.
Grey horizontal areas correspond to different application servers, yellow background represents daytime from Monday to Friday. Different colours represent different scheduling options for agent instances (daily, weekly, after another agent run). Clicking on any instance shows additional information about its configuration.
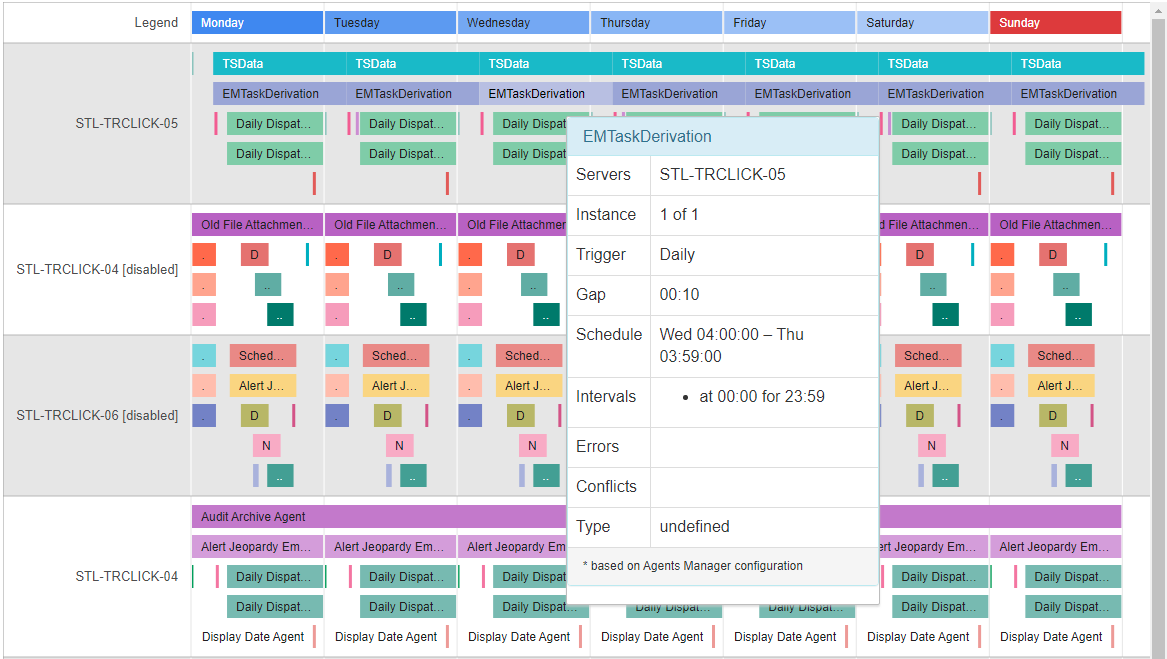
This diagram also graphically shows which agent instances are scheduled to which application server at what time on a weekly basis, but it uses an alternative visualisation where multiple parallel instances are visualised in parallel. While not as readable, this visualisation makes it much easier to assess the maximum parallel load imposed on an application server.
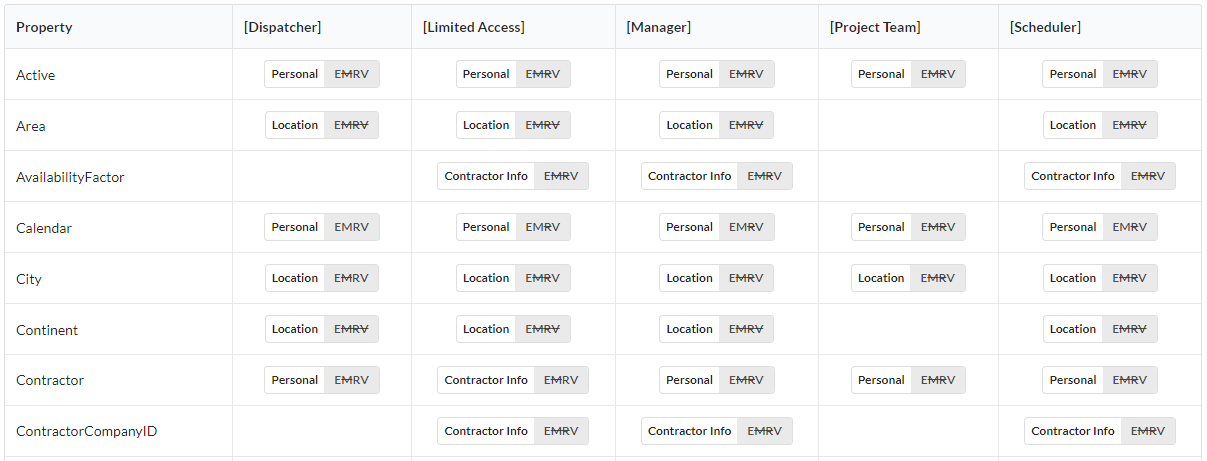
This report documents various aspects of user templates, most importantly forms defined for different collections for different products.
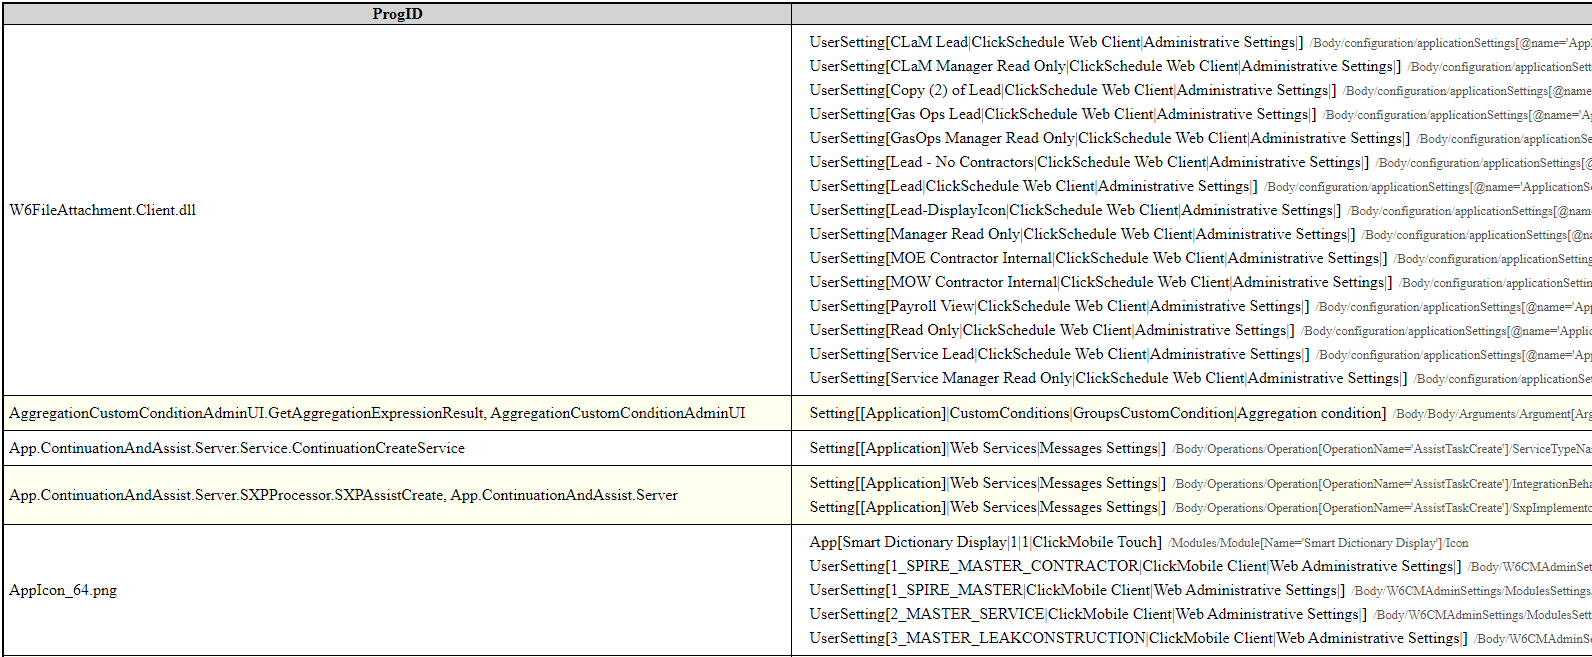
This report identifies everything in the configuration that looks like it could be a ProgID or a component name, and shows which items and where within those items refer to those “components”. While not everything that is discovered in this way will be a custom component, this report is indispensable in migration where users want to know what customisations are actually used in the configuration and where.
